Whether you’re Data Analyst, Data Engineer or Data Scientist there’s just no running away from data cleaning. It’s the essential skill that you need if you want to make a career in data. I am writing this blog to share 5 unique data formatting challenge that I faced in my last project working for my client.
Tip : If you are preparing for you python interview this might be a good practice.
- Creating tables from a nested json files.
- Extracting the month name directly from month number.
- Masking the confidential columns in your data.
- Concatenating excel sheets with sheet names as alias for identification.
- Formatting a complex dictionary to a required dataframe.
1. Creating tables from a nested json files

This is the sample json object that we need to start with
My first impression while staring at this problem was there must be definitely a method in pandas that can directly read json files and thank god that assumption came true. But let’s analyze this json little further as it appears to be nested.
After little exploration I could understand the structure little better

Next, let ushop on to Jupyter notebook and directly fire a query that reads a json file.
df = pd.read_json(‘test.json’)
df.head(3)
Executing above code produces the below output

Clearly, we can see there’s clean table barring the 1st columns. And if you observe closely, you will also find a mapping between the 1st column and the rest of the table. [ emp_id =1 & Id = 1] At this point, I was convinced that these might be stored as two tables one serving as a master for the employees and other(1st column) having detailed information about them.
#only working on the 1st column.
d1 = pd.read_json(‘test.json’).iloc[:,0]#creating an empty dataframe
df = pd.DataFrame()#looping through each sequence and concatenating them
for i in d1:
df1 = pd.DataFrame(i)
df = pd.concat([df,df1])
df
The above code upon execution will show a nice clean table which goes as follows
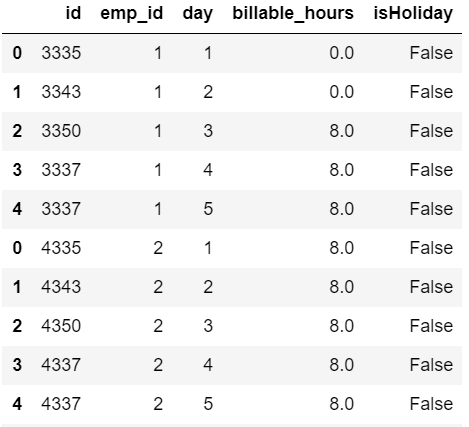
That completes the first table which was just contained in the 1st column. For extracting the master employee table the code goes down below.
#Skipping the first column and saving the rest of the table
d2 = pd.read_json(‘test.json’).iloc[:,1:]
For beginners, I would like to point out that this is just one small task and ideally for carrying out these kind of specific task we should develop a habit of packing our code together by writing them in functions. Down below is the small example of how to piece all things together and also make sure to avoid hard coding.
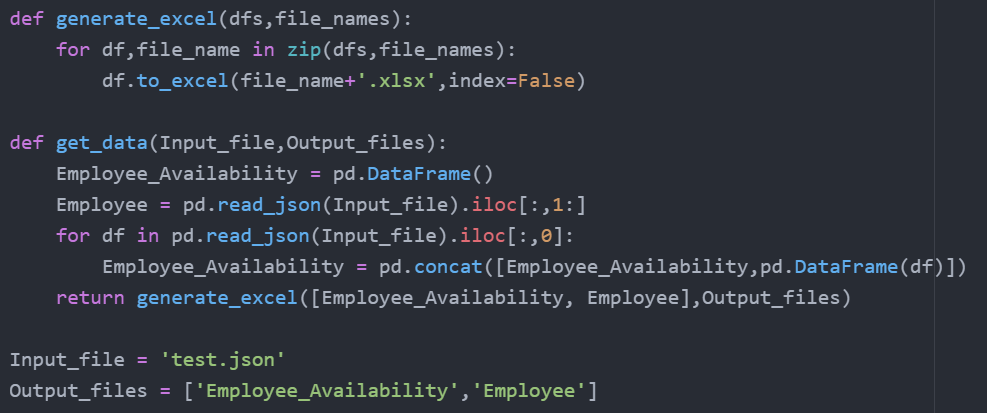
This might be less readable. The roadmap to get here should be by writing simple one liners first and then bundle them together in a function like this.
2. Extracting the month name directly from month number.
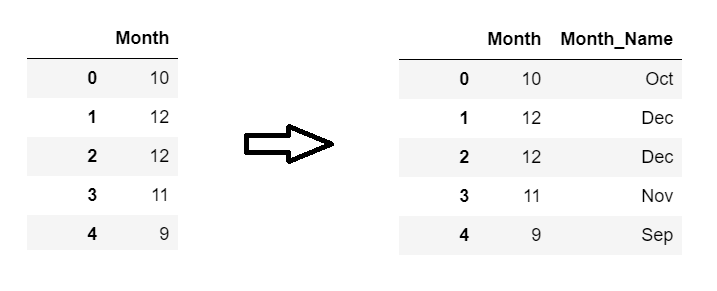
This is the task.
This is easiest of all the five tasks only if you know the right library.
import calendardf[‘Month_Name’] = df[‘Month’].apply(lambda x: calendar.month_abbr[int(x)])
The above code should be enough for you if your ‘Month’ column does not contain missing values which was not the case for me. So, I had to write a code to incorporate that. Down below is the complete version of it
df[‘Month_Name’] = df[‘Month’].fillna(0).apply(lambda x: calendar.month_abbr[int(x)] if x!= 0 else np.nan)
calendar.month_abbr[int(x)] might throw up an exception if it encounters a missing value and hence we need to impute it first and then write an else condition to restore it NaN.
3. Masking the confidential columns in your data.
Before jumping to the code I want to talk about the reason behind masking. When you work with consulting firms chances are you might have to deal with third party who may or may not have signed NDA. For people hearing NDA for the first time — Non-disclosure Agreements are an important legal framework used to protect sensitive and confidential information from being made available by the recipient of that information.
I was in a situation where we were dealing with the sample data and it involved sending it to a third party.
Now let’s jump on to the code. Here’s the sample data
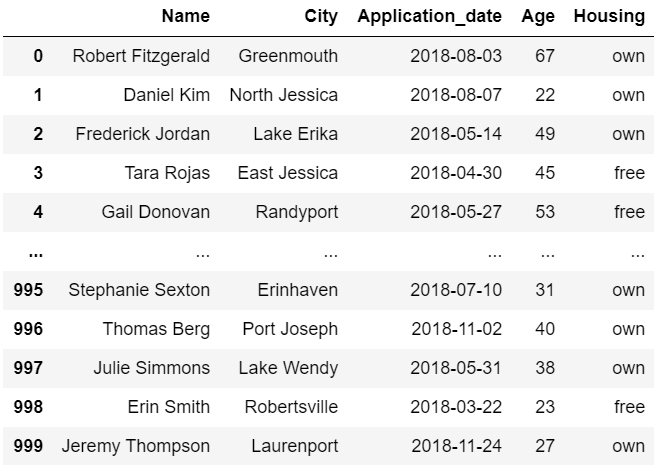
find the data at : Data
Chance are you might have never heard of the package called ‘cape-privacy’
So. I would recommend you install this right away if you wish to emulate the same exercise at your end.
# pip install cape-privacy
Now this library has an array of method. It generally aims at providing data privacy and data perturbation. I will link some good resources below right at the end of this blog where you can explore more about this package.
We want to import the transformation class from this module
from cape_privacy.pandas import transformations as tfms
This class has lot of methods associated with it to use. We can check them by firing below query
tfms??
This will take you to the below output.
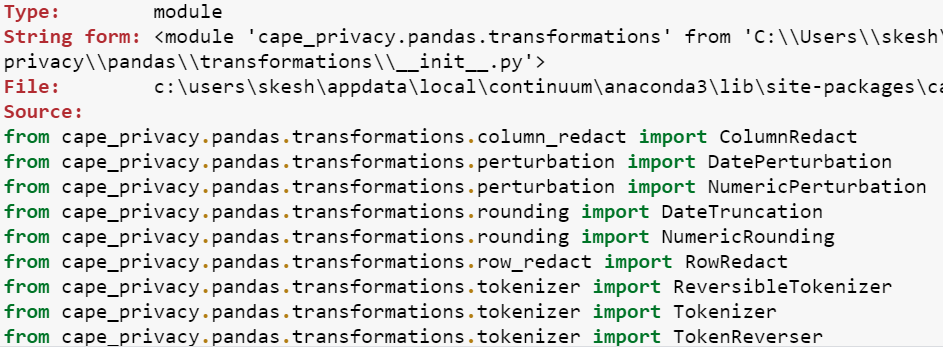
You can check the documentation of each one of them in details by further querying on the specific method. I’m going to use Tokenizer let’s read and understand the documentation as we are using this for the very first time.
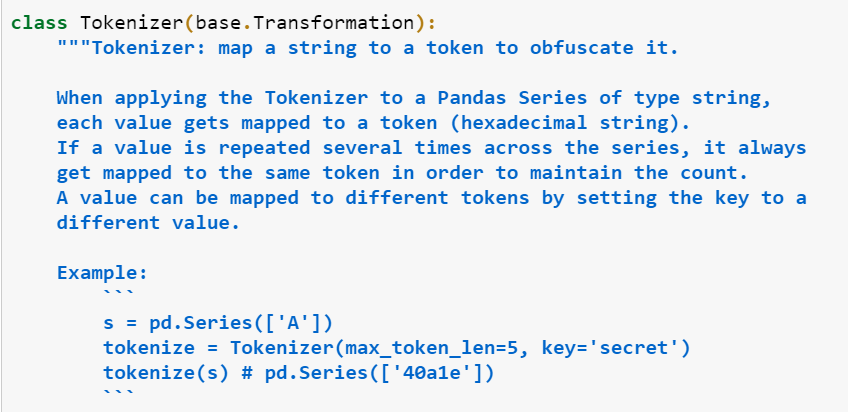
This is just a part of the documentation. When you execute this you will see details of attributes and examples associated with the same method.
Ok. So, the example given tells us that we need to specify a parameter called ‘max_token_len’ which should tell python the length of the masked data. The other parameter ‘sceret’ allows the masked data to be reversed to their original data when the secret
key is known we which really don’t need as of now.
And here goes the final execution.
tokenize_name = tfms.Tokenizer(max_token_len = 20)
df[‘Name’] = tokenize_name(df.Name)
df
And we have our masked data.
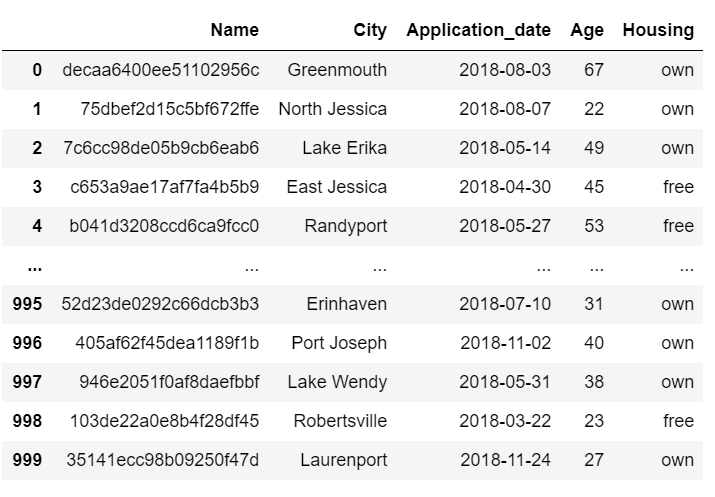
Pheww !! Now I can safely ship the data to third party.
4. Concatenating excel sheets with sheet names as alias for identification.
If the heading does not make sense to you then just ignore it and look at the image down below.
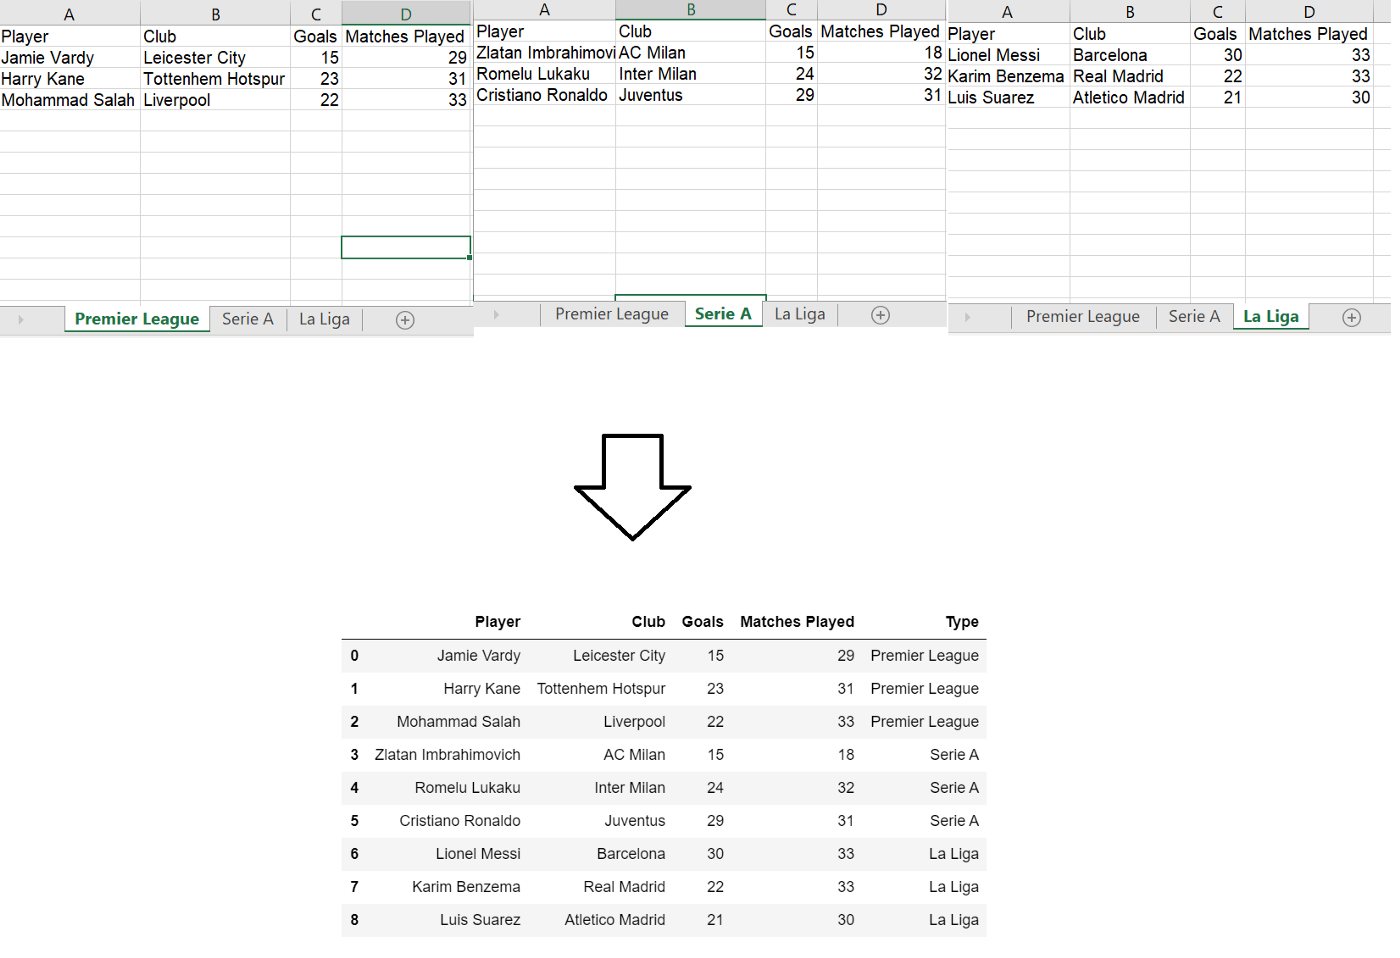
We have data containing multiple sheets and we need to combine all of them together with sheet name as new column for identification
In actual scenario I had more than 30 sheets and hardcoding the sheet names was simply not an option. I am using pandas for 4+ years yet I was never aware of a method which directly fetches the sheet name.
This can be achieved by simple two liner
path = ‘Football_Data.xlsx’
sheetnames = pd.ExcelFile(path).sheet_names
sheetnames
Output : [‘Premier League’, ‘Serie A’, ‘La Liga’]
Leveraging this output we are going to run a loop and add sheets one after another by using
pandas.concat as we saw in the 1st task in the blog
df = pd.DataFrame()
for name in sheetnames:
df1 = pd.read_excel(‘Football_Data.xlsx’,sheet_name = name)
df1[‘Type’] = name
df = pd.concat([df,df1])
df.reset_index(drop=True,inplace=True)
The resultant dataframe.

I never though this would be as simple as this.
5. Formatting a complex list to a required dataframe.
The question goes something like this
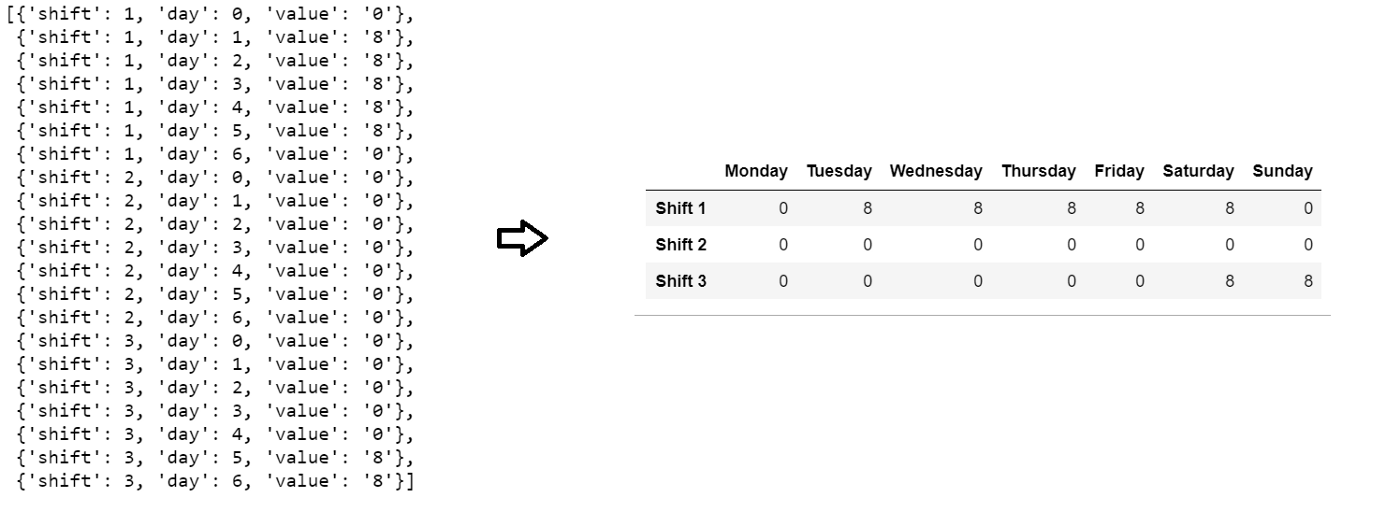
At this point you can pause reading the blog and take up this challenge. I was interviewing someone for a senior Data Engineer role and gave this problem to test the candidate’s python skill. So if you are able to solve this in 15 mins(yes you can google) you can consider your self to be at a very good place ad I will rate you 4.5/5 in Python.
Way I approach these kind of problems is by starting from an absolute baseline by firing the below query blindly
#sliced for the first shift by looking at the target dataframe
pd.DataFrame(availability[0:7])
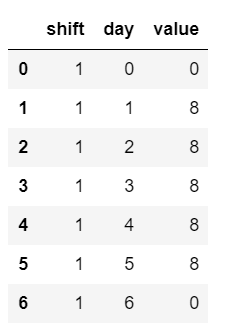
We are no way near the output dataframe but one realization came to my mind that we might have to go for a transposed version of this dataframe.
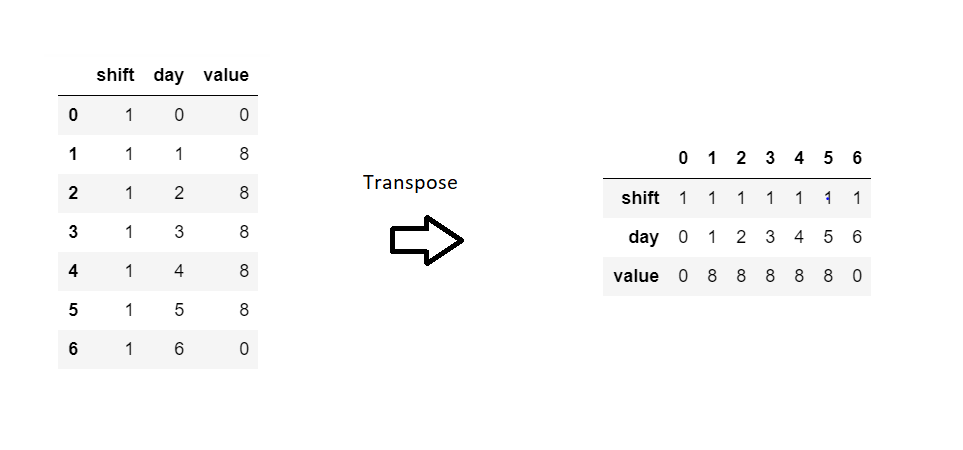
Now compare this intermediate dataframe to the final resultant data frame. You will realize that only thing required from this data is last row and the index needs to be renamed from ‘value’ to ‘shift 1’.
So, at this point. I need to make sure.
- Get rid of the rest of the rows.
- Renamed from ‘value’ to‘shift 1’ before transposing
- Get rid of the shift and day value.
Let’s do that and see the results
pd.DataFrame(availability[0:7]).rename(columns={‘value’:’shift’ + ‘1’}).iloc[:,2:].T

Now, we are somewhat close to our resultant dataframe. Next two tasks are
- Convert the 0,1,2… to Monday, Tuesday, Wednesday..
- Run a loop for all the shifts by slicing every 7 rows from the starting dataframe.
Step 1 goes as follows
import calendardf = pd.DataFrame(availability[0:7]).rename(columns={‘value’:’shift’ + ‘1’}).iloc[:,2:].T
df.columns = list(map(lambda x:calendar.day_name[int(x)],df.columns))
df
Does the above code ring any bells? 🙂

Now. Putting all of it together
df = pd.DataFrame()for i in range(0,len(availability),7):
df = pd.concat([df,pd.DataFrame(availability[i:i+7]).iloc[:,2:].T])
df.index = list(map(lambda x:’Shift ‘+str(x+1),df.reset_index(drop=True).index.values))df.columns = list(map(lambda x:calendar.day_name[int(x)],df.columns))df

Resultant DataFrame
Conclusion
These tasks might not appear so difficult as we have libraries in place that does the job for us but if you are a beginner or an intermediate in python chances are you might have never used some of them before.
Thank for reading.


